Web App
The Culture Map, Visualised
An interactive reading of Erin Meyer’s eight Culture Map scales: explore country positions, compare your team, and see where cultures differ at work.
Visit Project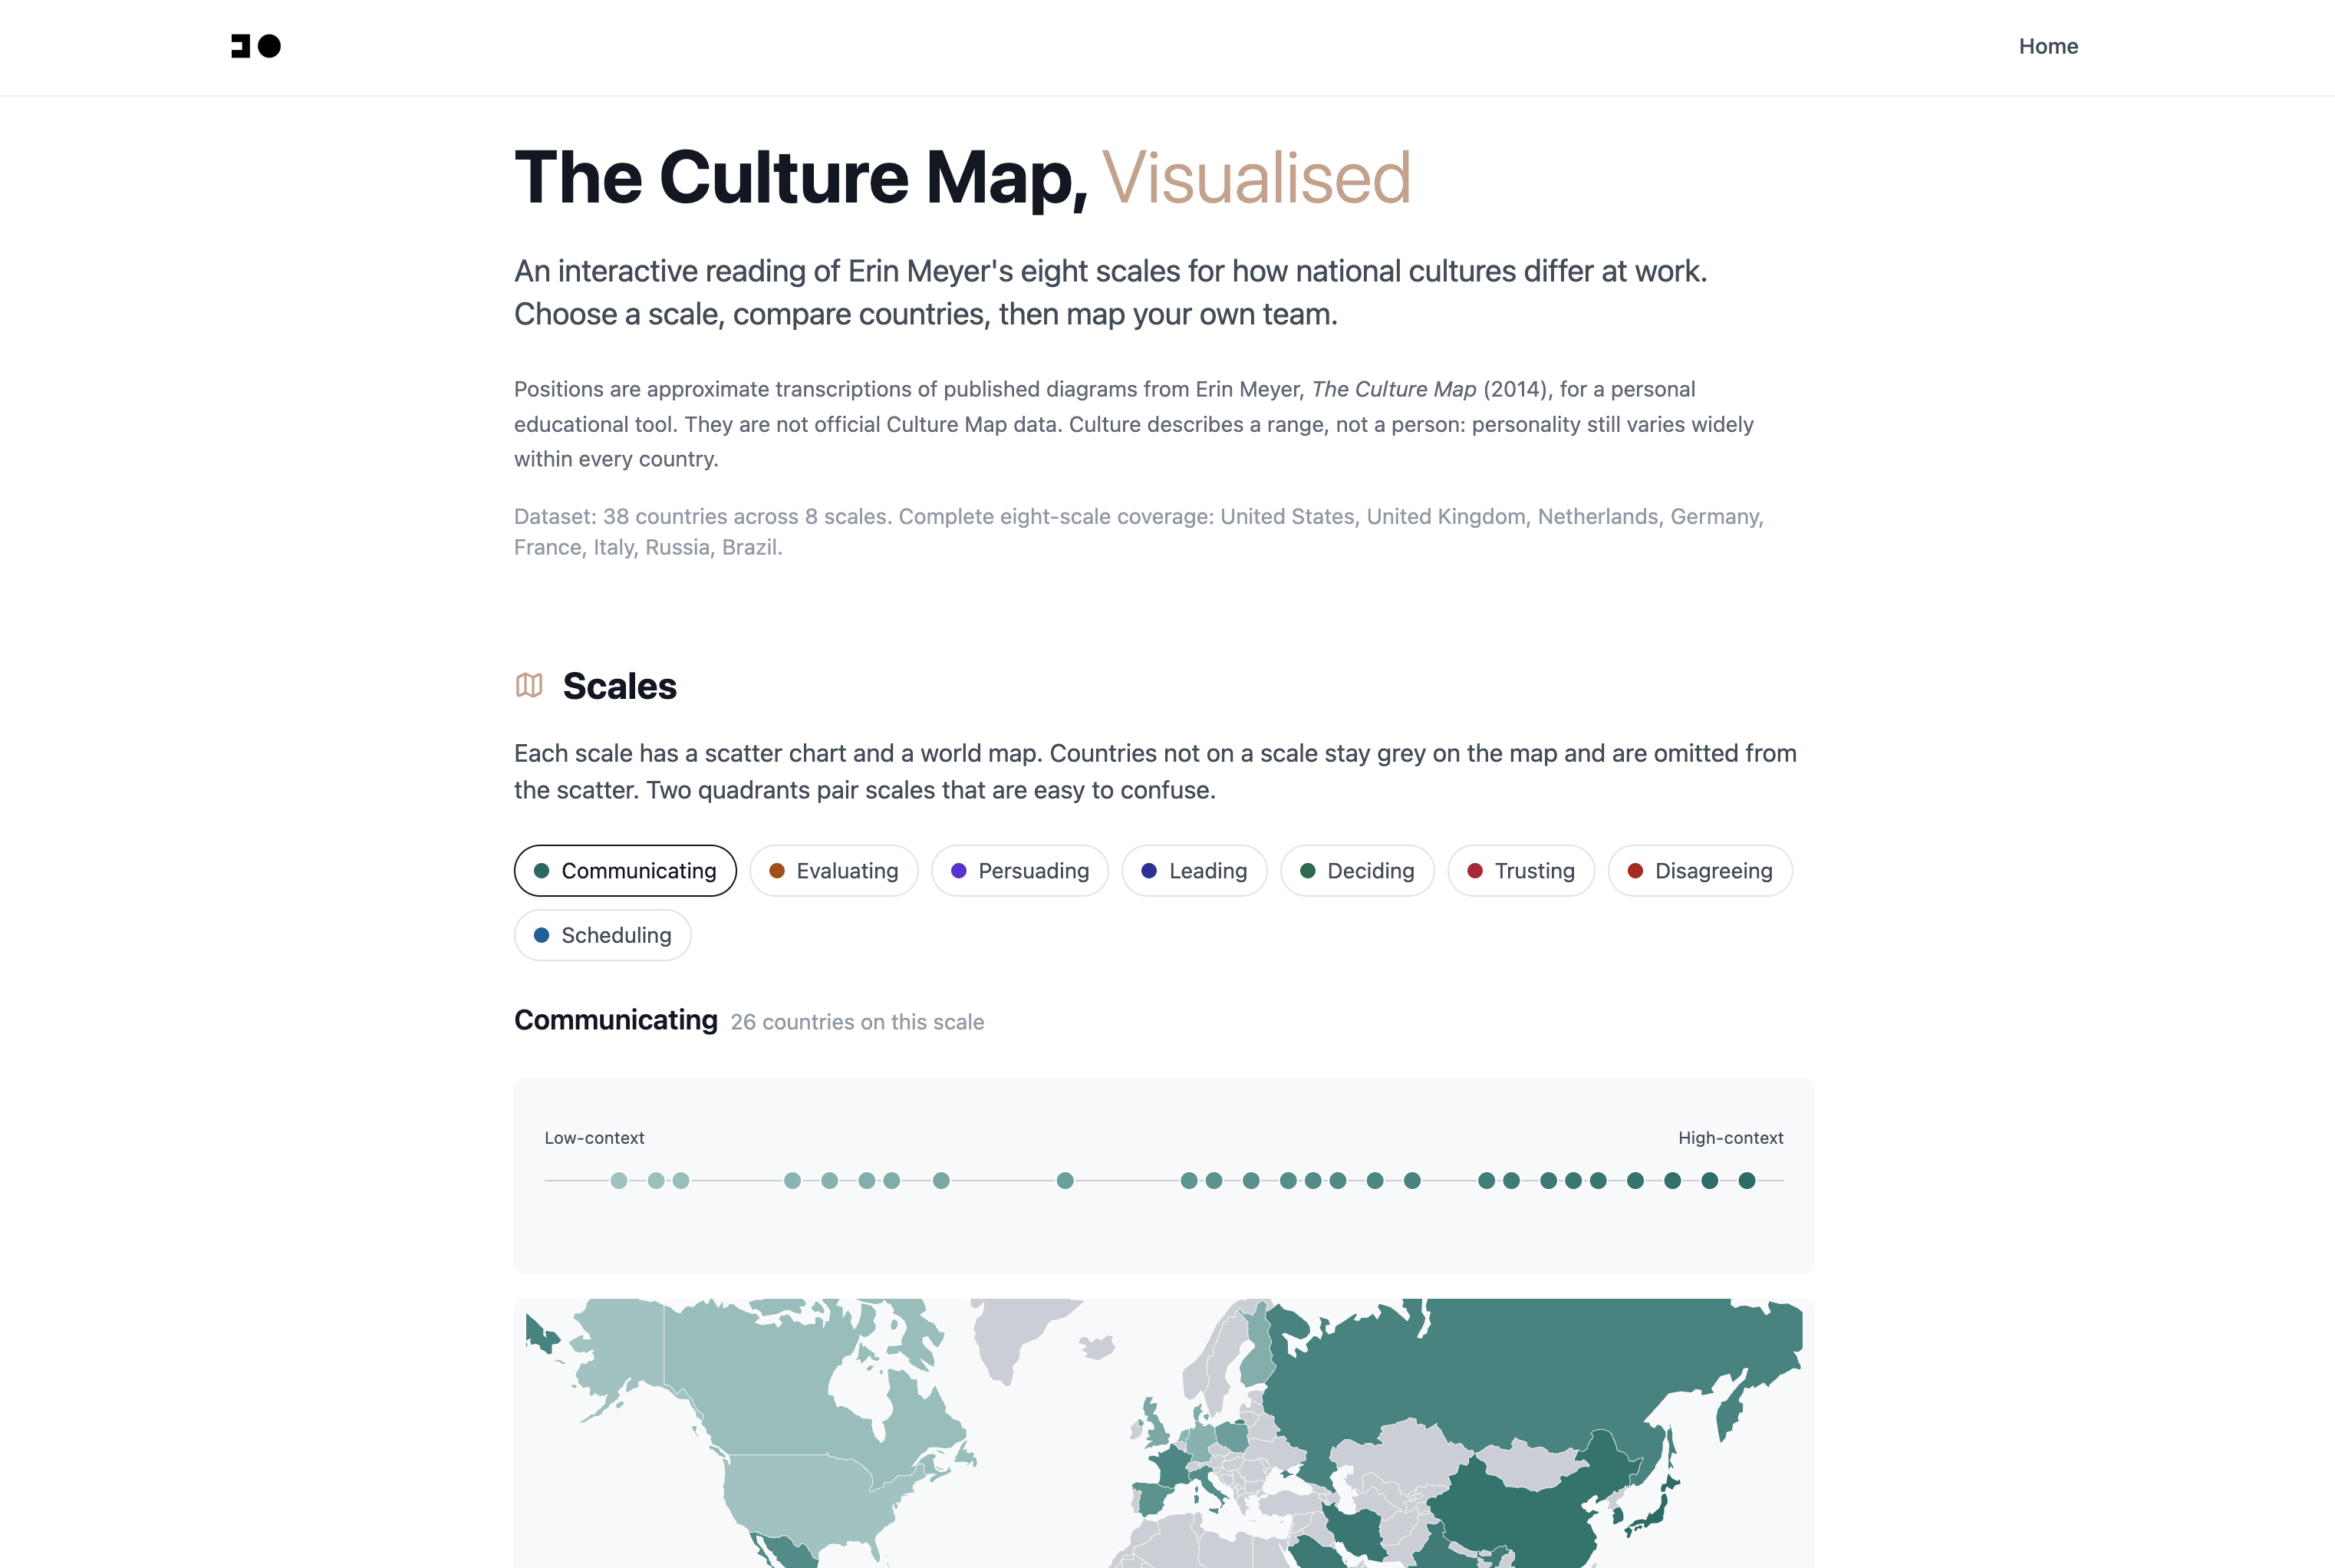
About
The Culture Map, Visualised turns Erin Meyer’s eight scales into maps, scatter charts, and a team Culture Guide on emrecanokten.com. Built with Next.js, TypeScript, and visx, it transcribes published diagrams into a searchable dataset, pairs each scale with a choropleth and beeswarm, and generates relative-position notes plus a country-profile chart. An optional self-assessment form stores anonymous 0–10 scores in Supabase so the dataset can grow beyond the book.
Milestones
- Digitised eight Culture Map scales and two quadrants into a country-level dataset
- Built interactive visx maps and scatter charts with linked hover and per-scale colour
- Shipped a Culture Guide that compares your nationality with teammates and plots a combined profile
- Added an anonymous self-assessment form with insert-only storage in Supabase